
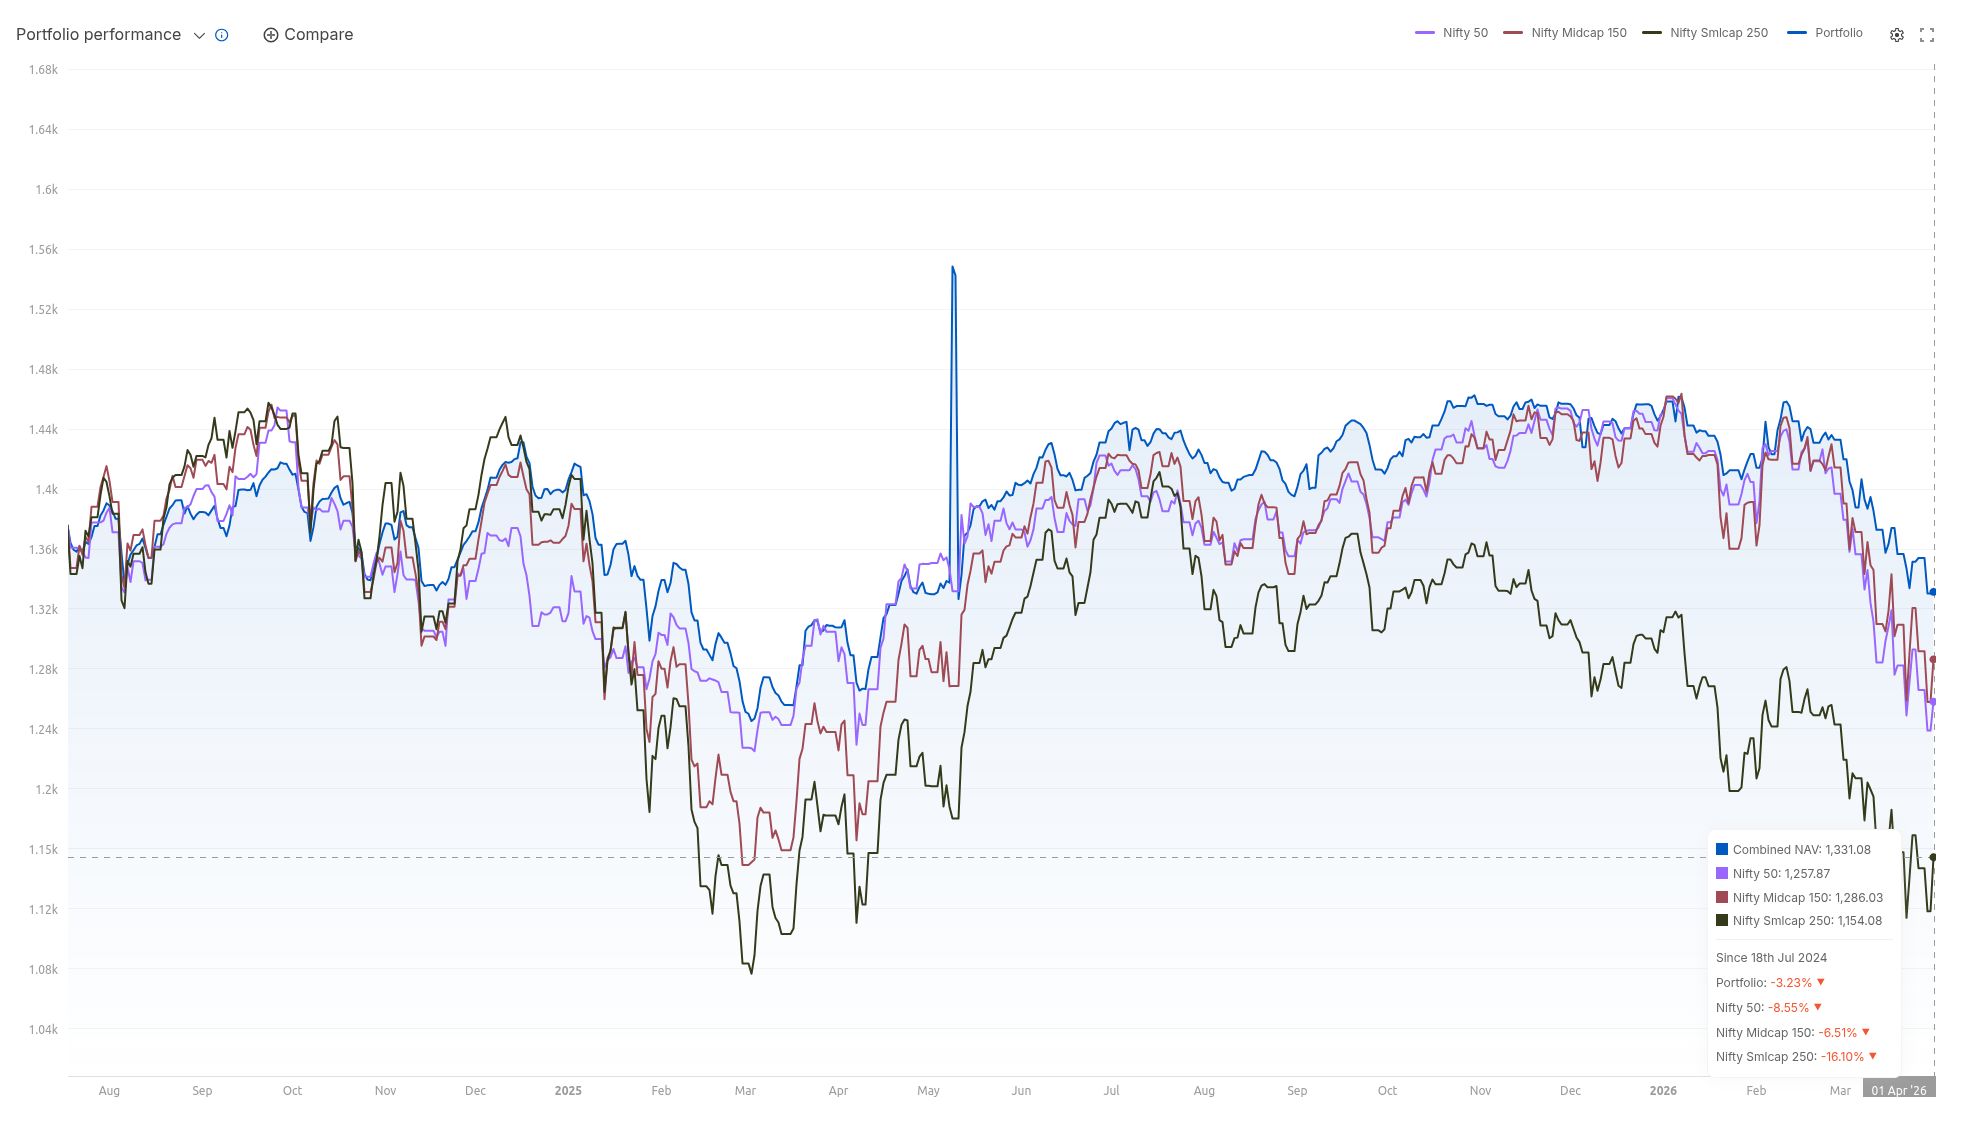
In a recent LinkedIn post, Nithin Kamath discusses the often-overlooked complexity behind seemingly simple financial performance graphs, highlighting the significant engineering effort required to accurately represent fund and stock payouts, and corporate actions.
Nithin Kamath emphasizes that the visual representation of an account performance graph on platforms like Console, while appearing straightforward, hides a substantial amount of intricate work. As he notes:
“The account performance graph on Console may look just like a simple chart, and I wouldn’t fault anyone to think so. But in reality, the sheer number of edge-cases with payout/payin of funds and stocks, corporate actions, etc., took enormous engineering effort to get right.”
The Hidden Engineering Challenges
Kamath’s post sheds light on the sophisticated backend processes that power these user-facing tools. He points out that accurately displaying performance involves more than just plotting data points; it requires robust systems capable of handling a multitude of financial events.
Handling Edge Cases in Financial Data
According to Nithin Kamath, the development team faced numerous challenges related to various financial scenarios. These include:
- Payouts and pay-ins of funds
- Handling of stocks
- Corporate actions (e.g., mergers, stock splits, dividends)
Each of these elements can introduce complexities that must be accounted for to ensure the performance graph is a true reflection of the account’s status. The “enormous engineering effort” required, as described by Kamath, underscores the technical prowess needed to build reliable financial platforms.
The Case for Diversified Portfolios
Beyond the technical aspects of data visualization, Nithin Kamath also reiterates his long-held belief in the efficacy of a diversified investment strategy. He uses the example of a colleague’s portfolio to illustrate his point.
“I’ve always said a diversified, steady portfolio is always the best bet to outperform. Here’s an example of a colleague’s diversified portfolio, consistently beating equity benchmarks, expressed as an account performance curve.”
Kamath uses this real-world example to demonstrate that a balanced approach, rather than speculative or concentrated bets, can lead to superior long-term returns. The visual representation of this colleague’s portfolio serves as a testament to the power of consistent, diversified growth, outperforming traditional market indices.
In essence, Nithin Kamath’s LinkedIn post serves a dual purpose: it educates his audience about the intricate engineering that supports financial tools and reinforces his investment philosophy centered on diversification and steady growth.
📝 About This Content
This article is based on insights shared by Nithin Kamath on LinkedIn.
📅 Originally posted on April 2, 2026 | View original post on LinkedIn →